Maps (and map tiles) at SFO Museum

This is a long blog post about maps that gets increasingly technical as it goes on. The short non-technical summary is that maps, and especially maps on the internet, are still a complex beast and we are beginning to stand (wobble?) on the shoulders of existing open source and open data projects to develop a long-term and sustainable maps infrastructure for the museum.
We are starting to think about maps. Some of you may have noticed a lot of maps in the pictures from our last blog post. Those maps are what this blog post is about.
Location and place, as you might imagine, are core to an airport. They are essential to any museum and museum collection, really, but for the sake of this blog post we’ll just say that location and place are core to our museum.
We need and want maps to contextualize our collection whether it’s where an object was created, where the institution that lent us an object is located, where in the airport that object is on display or where on the larger campus a photo from the archive depicts. It might also be where an airplane is manufactured, where it’s going or where it’s coming from. The list goes on.

We also want a variety of different maps. We want maps for wayfinding but, equally, we want stylized maps whose function is to be the soundtrack to a larger story. We want historic maps to help people understand the evolution of the airport and the museum itself.
Maps it turns out are also a useful lens to help think about sustainable infrastructure in general, and this is especially true for a museum. In order to explain why we need to take a brief detour and review what I call:
A short history of maps and the internet
What follows is an aggressively simplified history of maps and the internet. People in the “business” of maps will no doubt quibble with the nuance and probably some of the details but, in broad strokes, there have been four major periods so far in this history.
Before Google Maps (aka “MapQuest”)
Saying “before Google Maps” is sort of like saying “before the discovery of fire” for all that most people can relate to the idea that such a time ever existed. Try to imagine a world where not only were maps on the internet static but were really really small because anything bigger was prohibitive in bandwidth speed and costs.
Google Maps (2005)

In 2005 Google launched their Google Maps product and nothing has been the same since.
Google decided that, for the purposes of their map, the planet was really a sphere (rather than egg-shaped) allowing it, equally, to be represented as a square. Google sacrificed the North and South poles and the good graces of cartographers and geographers ever since because performing math on squares was easy, even in the underpowered (by today’s standards) web browsers of the day.
Google reduced the map (the entire world) to squares identified by “zoom” levels. Zoom level “1” contains a single square depicting the entire planet. Zoom level 2 contains 4 squares, zoom level 3 contains 16 squares and so on with every zoom level containing more detail and specificity.
When they launched there were 16 zoom levels; 16 maps (pictures) of the same thing but with different levels of resolution, all cut up in to little squares of the same size.
Maps on the internet no longer meant producing and downloading a single large and detailed map but rather downloading lots of tiny pieces of a map and reassembling them in the browser.
OpenStreetMap (2004)
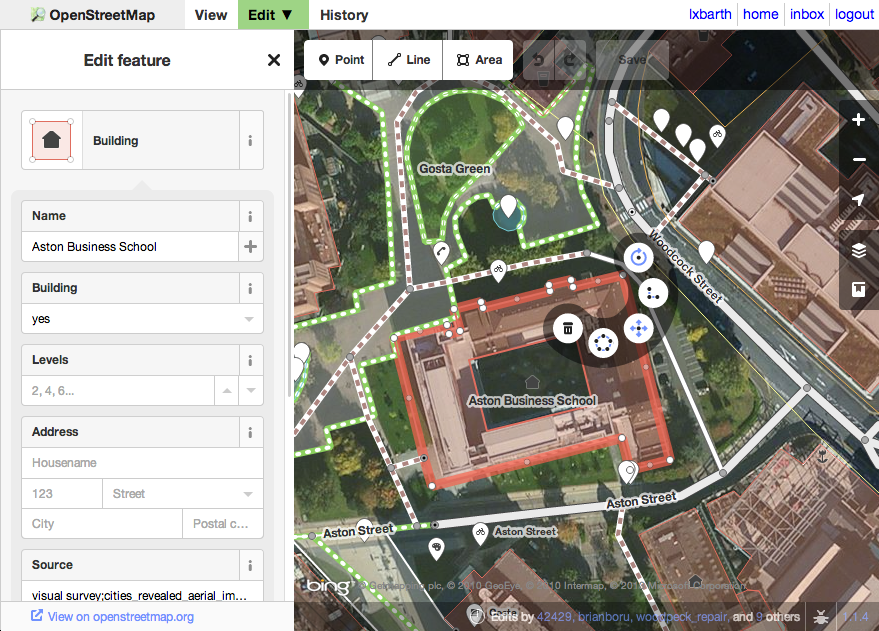
I’ve included OpenStreetMap (OSM) after Google Maps because while it was launched a year before Google Maps it wasn’t until 2007-2008 that it really began to come in to its own. OSM is an openly licensed, free to use, map of the entire world created and managed by volunteer users. Both the finished map and the raw data used to produce that map are available for anyone to make maps of their own.
OSM is not without its controversies but it has, in a short 14 years, accomplished the impossible demonstrating that a community-run project can produce a finished product, and the infrastructure needed to do so, whose quality rivals and often exceeds that of the large commercial vendors.
Google didn’t stop thinking about maps after 2005 and today, in 2018, they continue to outpace their competitors. They have earned their success but they also have resources and operate at a scale that is so far removed from most people’s means that having an alternative to Google, like OSM, is critically important.
Vector Tiles (c. 2012)

I think the term “vector tiles” is a misnomer. When most people talk about vector tiles what they are really saying is tiles that contain data describing a place rather than tiles that contain a grid of differently colored pixels depicting that place, what have traditionally been called “raster” tiles.
There is actually a rich vein of work encoding and visualizing complex data sets in the red, green and blue values of plain-old raster tiles but we’ll save that discussion for another time.
A rule of thumb when producing map tiles at a global scale is that everything is manageable up to zoom level 10, things start to get hard at zoom level 13 and zoom level 16 is where you start to think seriously about giving up. This is relevant because there are, and should be, many legitimate ways to depict and represent the same (map) data. In 2018 the norm is for most maps to have 20, or more, zoom levels so the cost of producing multiple representations of the same data can be non-trivial.
The reason that vector (or data) tiles are important is that all of the work of rendering a map, converting the data in to a representation, is handled by the consumer of the map rather than the producer. Google, and others, now create a single tile set containing metadata about the stuff in that tile’s geographic extent.
Generally anyone who makes a vector tile set also has some kind of styling language and a rendering engine for turning all this data in to pictures. That allows everyone to take advantage of all the advances in computer graphics and rendering capabilities in modern web browsers and devices at a fraction of the time and cost.
And there’s the rub

Vector tiles have been a net-win for maps on the internet and cartography in general. The kinds of maps they’ve made possible is incredible and astonishing.
The downside, however, is that in order to use those maps you need a whole lot of advanced software (and often hardware) that depends on a lot of other very advanced software (and more hardware still, sometimes). Often two software packages won’t keep track of each other’s changes and occasionally one piece of software simply chooses not to work with another piece of software.
There’s nothing map-specific about this phenomenon. It has existed since the beginning of computing. It’s just a problem that feels especially acute when we’re talking about maps.
For example, most vector tile rendering engines use something called WebGL which requires a graphics card and some sort of display in order to work. The results can be amazing. The downside is that rendering static, or raster, version of a complex vector tile on a computer without a display is so difficult as to seem impossible.
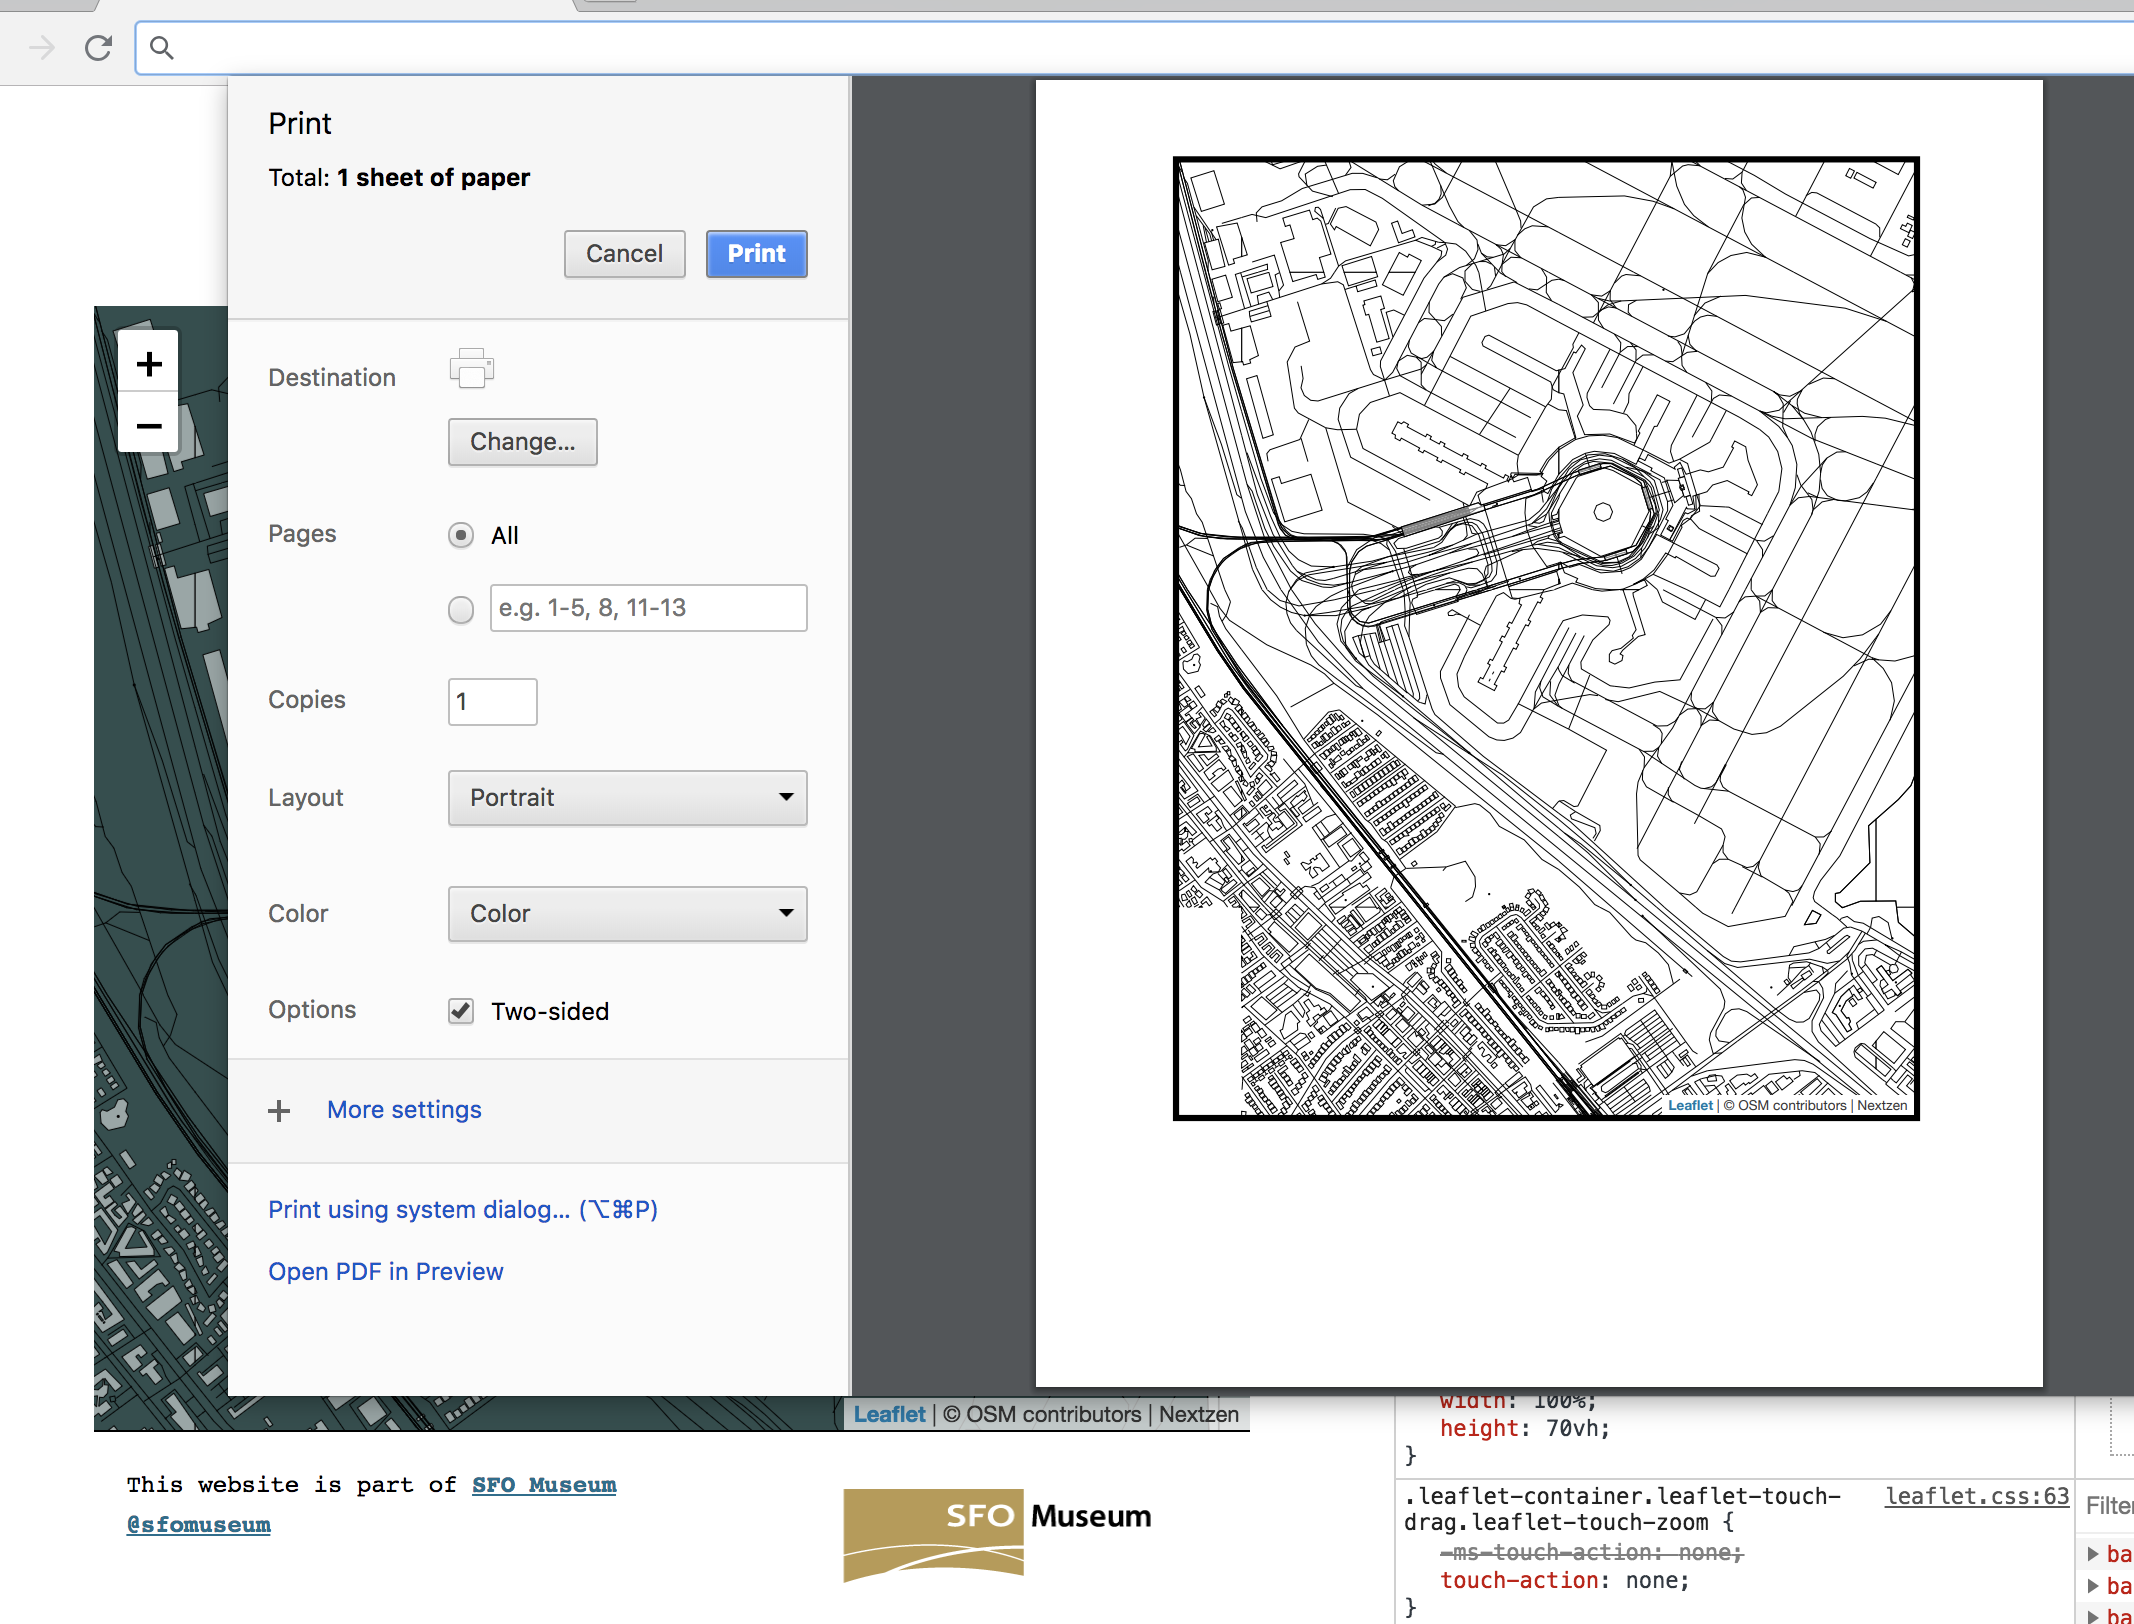
Raster tiles might not seem like a concern in a world where vector tiles exist until you remember that raster tiles will be included when you print a webpage and vector tiles… will not. Print is just one example but there are plenty of situations when a static map that doesn’t require a small mountain of real-time computing to realize is needed.
The good news is that by making a “tile containing data” the core unit of currency for maps it is still possible to produce future representations when the specifics of a given rendering technology no longer fit the circumstances of the world.
The bad news is that rendering data graphically is still hard. It is probably still best summed up by the expression “death by a thousand cuts”. People who use maps are often ill-equipped and rarely have the time to deal with those details, especially so when some part of a complex processing chain breaks.
So that’s what this blog post is about. But first, we need to take another quick detour and discuss:
A short history of the “(map)zengularity”
Between 2015 and 2017 I worked for a mapping services company called Mapzen. Mapzen was founded in 2013 and its goal was to build, and offer as services, all the tooling that it takes to deploy a map on the internet. This is all the stuff that Google has successfully (artfully, even) managed to hide from people but is still there under the surface.
Not only was Mapzen going to tackle building its own routing engine, search engine, graphics rendering engine along with user-facing styling tools for both browser-based and native applications, mobility and transit products, a gazetteer with global coverage and developer kits for using everything on Android and iOS it was also going to design its own cartography and produce, manage and deliver its own map tile infrastructure.
And it was going to do all of this using only open source software and open data sources, in particular OpenStreetMap. It was an ambitious project that had a good run but eventually shut its doors in 2018. One of the things that Mapzen was able to do, in late 2017, was produce a final “build” of its vector tiles dataset for the entire planet.
These tiles and the cartographic styles that were developed during the Mapzen years now live under the umbrella of the Nextzen project and are freely available for anyone to use.
That’s a pretty big deal.
So that’s what this blog post is about (for real, this time)

Normally, you’d use Nextzen tiles with Tangram a Javascript library for rendering the Nextzen data as beautiful maps in the browser. That’s what we’ve been doing for some of our earliest work in thinking about how to make the airport, the museum, the collection and the internet all hold hands.
Tangram is an amazing piece of work but it has two properties that we didn’t want to be limiting factors for the use of maps in our work going forward:
First, WebGL is not well-supported in older browsers and older hardware (even on modern hardware it’s not hard for WebGL to make your browser work so hard that your computer’s fan turns on). Second, as I described earlier, WebGL elements on a webpage are not printable.
We want to make sure that the work we do going forward is available and accessible to as many people as possible, many of whom won’t have the luxury of the latest and greatest technologies. Or even, in some cases, uninterrupted access to the internet so seemingly “little” things like printing a web page become all the more important than they might seem at first glance.

I mention all of this because the data that Nextzen returns in their vector tiles is encoded using the GeoJSON format. This is important because it’s possible to convert GeoJSON in to something called a scalable vector graphic or SVG. SVG is a format for describing vector graphics in a web browser which means we can convert the textual description of a map tile in to a graphical representation of that data.
Almost. SVG files are actually just text files but there are tools, besides your web browser, for rasterizing them which is fancy-talk for turning them in to static images.
“rasterzen”
We’ve been working with and contributing to a piece of software called go-rasterzen that does everything I’ve just described, transforming the raw Nextzen vector tile data in to an SVG representation and then finally a PNG image file.
It works like this:
- Instead of asking for tiles directly from Nextzen a map application requests them from a
rasterdserver (which is part of thego-rasterzencode). rasterdproxies tile requests to Nextzen and then for each tile it receives:- Performs some necessary house-cleaning producing an intermediate data (vector) tile called the
rasterzenlayer and then: - Transforms the
rasterzentile in to anSVGtile and then: - Transforms the
SVGtile in to aPNGtile and: - Caches each step and every transformation for future use.

And just like that we have three new tiles: One tile we can use with complex rendering engines like Tangram, one tile we can use vector-editing tools (like Illustrator) and one tile that’s just an image file.
All of those tiles are cached on machines that we control which means that if Nextzen suddenly went away tomorrow we’d have a little bit of breathing room to figure out what to do next. That feels like progress.
In a world where everything “is a service” and some of those services have abbreviated lifespans (at best) it becomes especially important to think about how those failure scenarios will affect our own efforts as they depend increasingly on third-party efforts.
Known knowns
It is important to note that these are early days for the project so there are lots of things that might prevent you from using it right now. In no particular order here is a list of known-knowns:
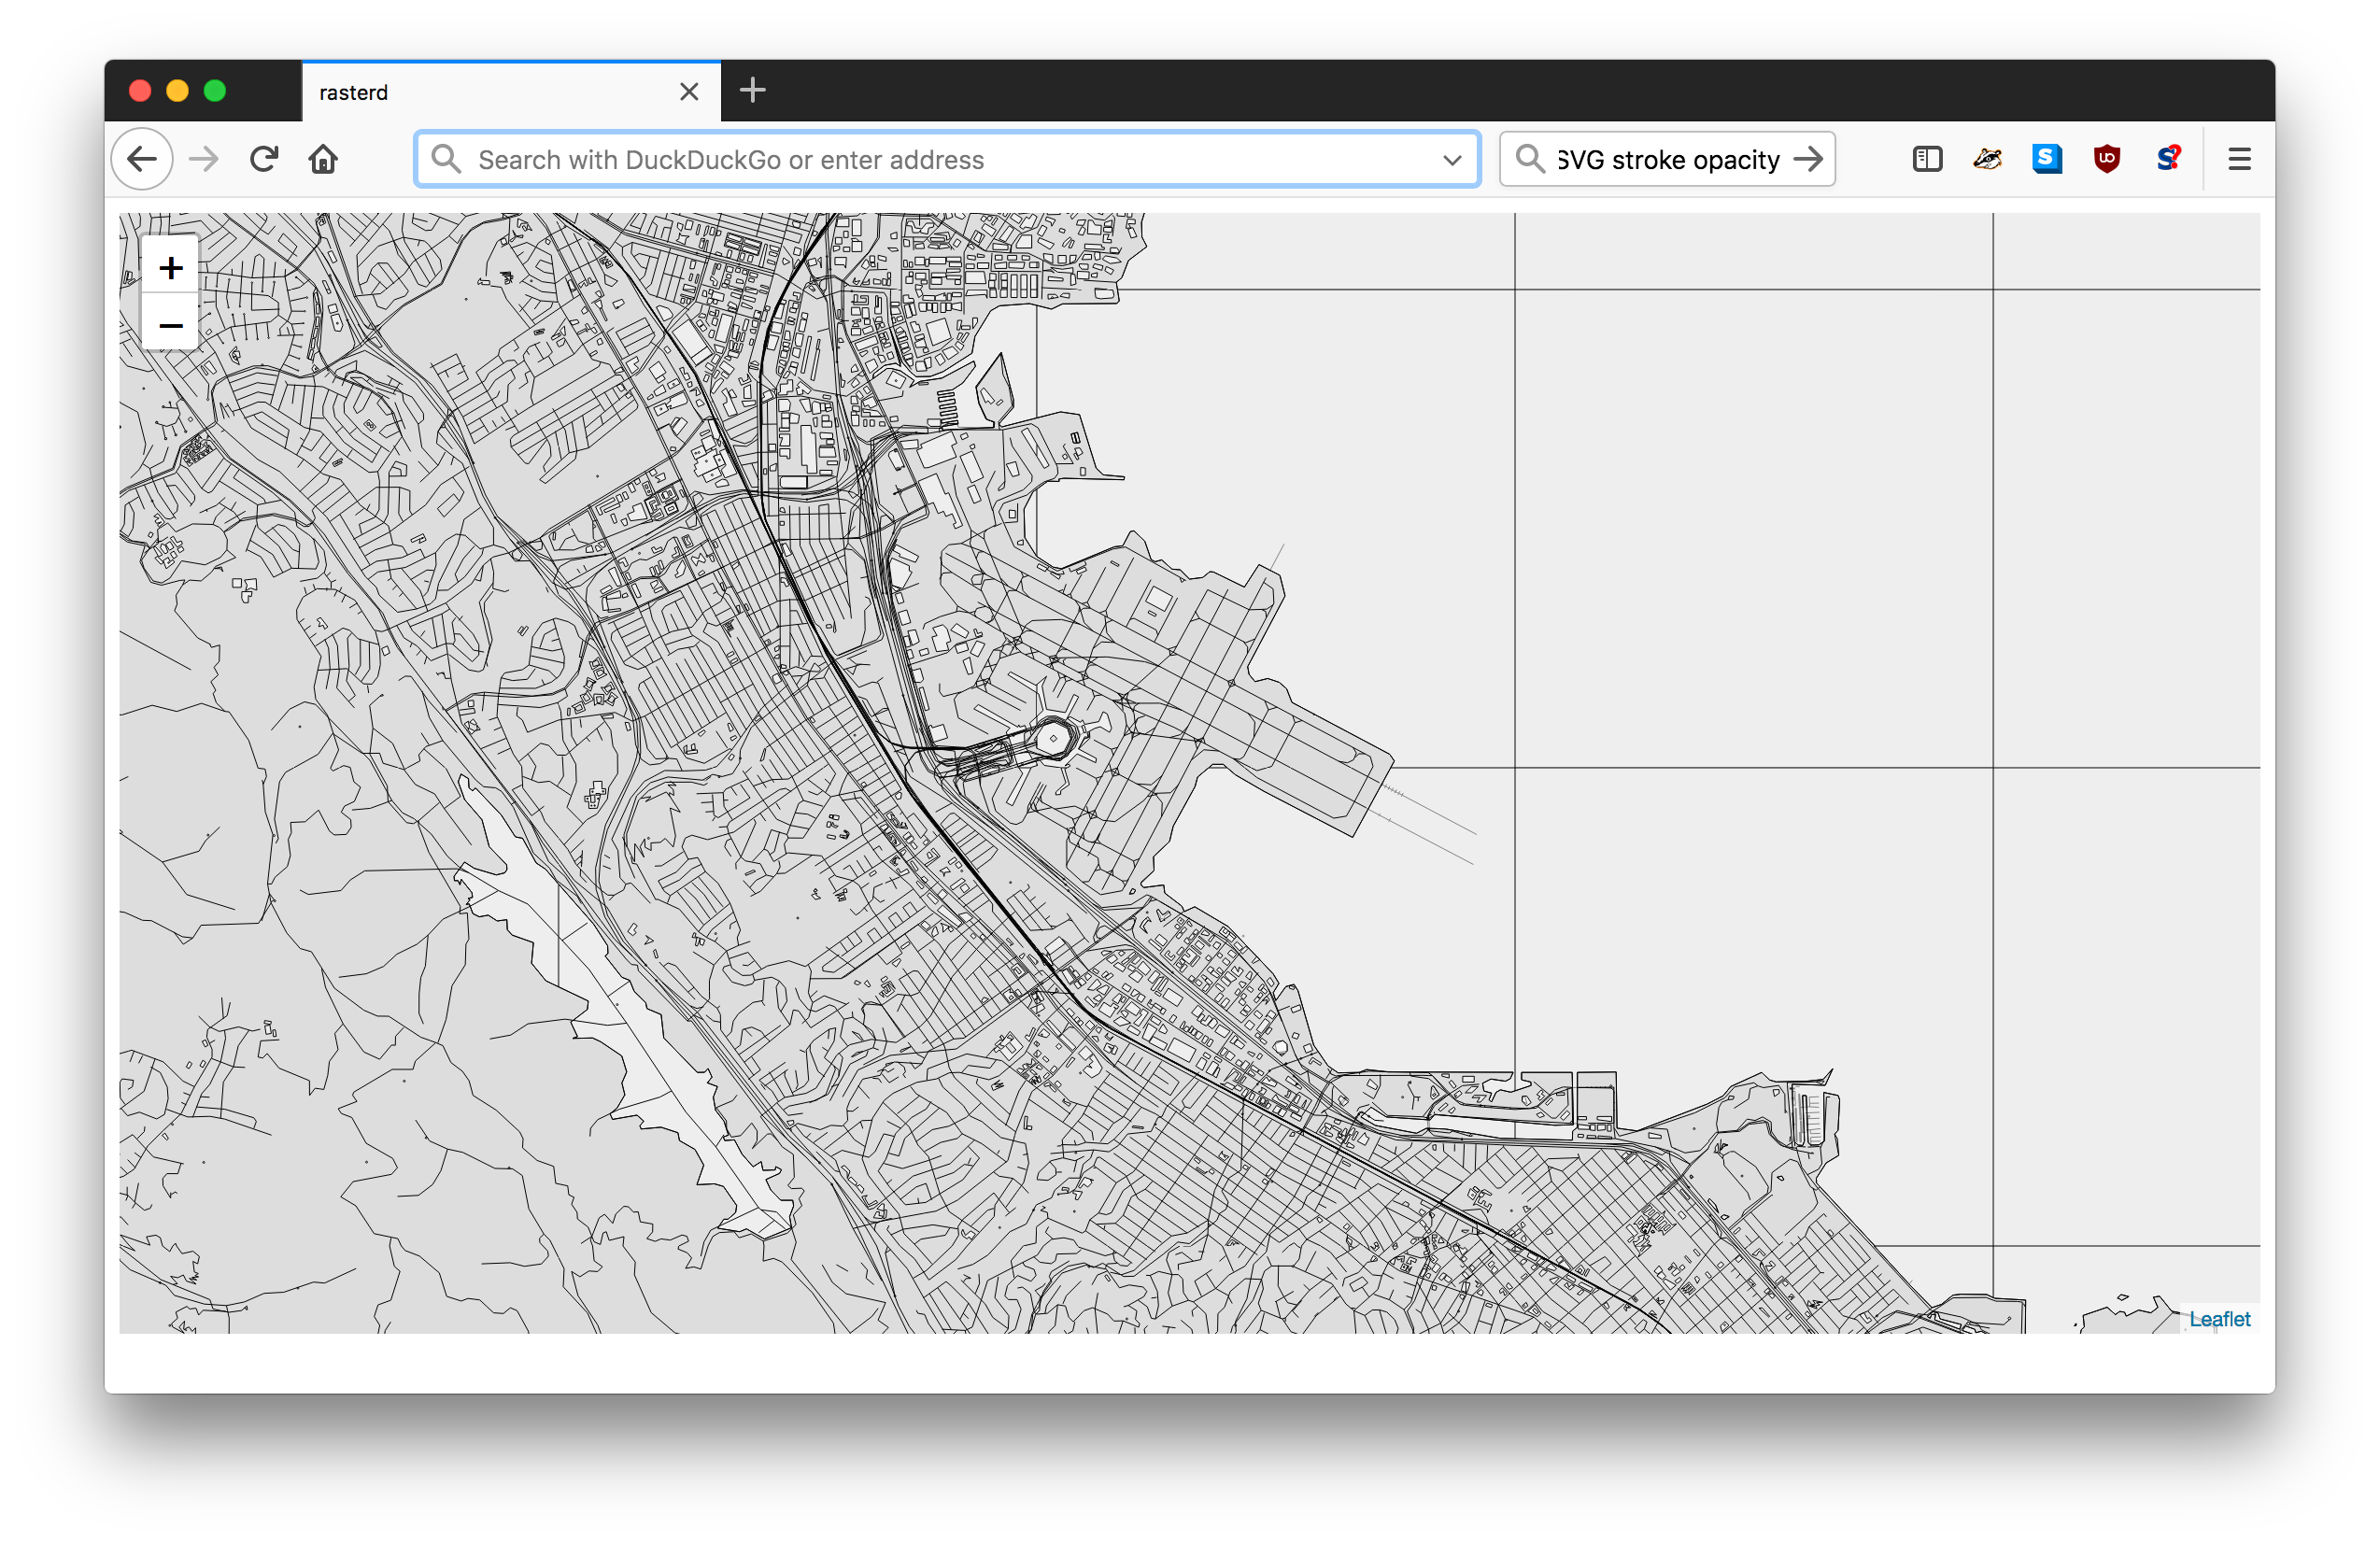
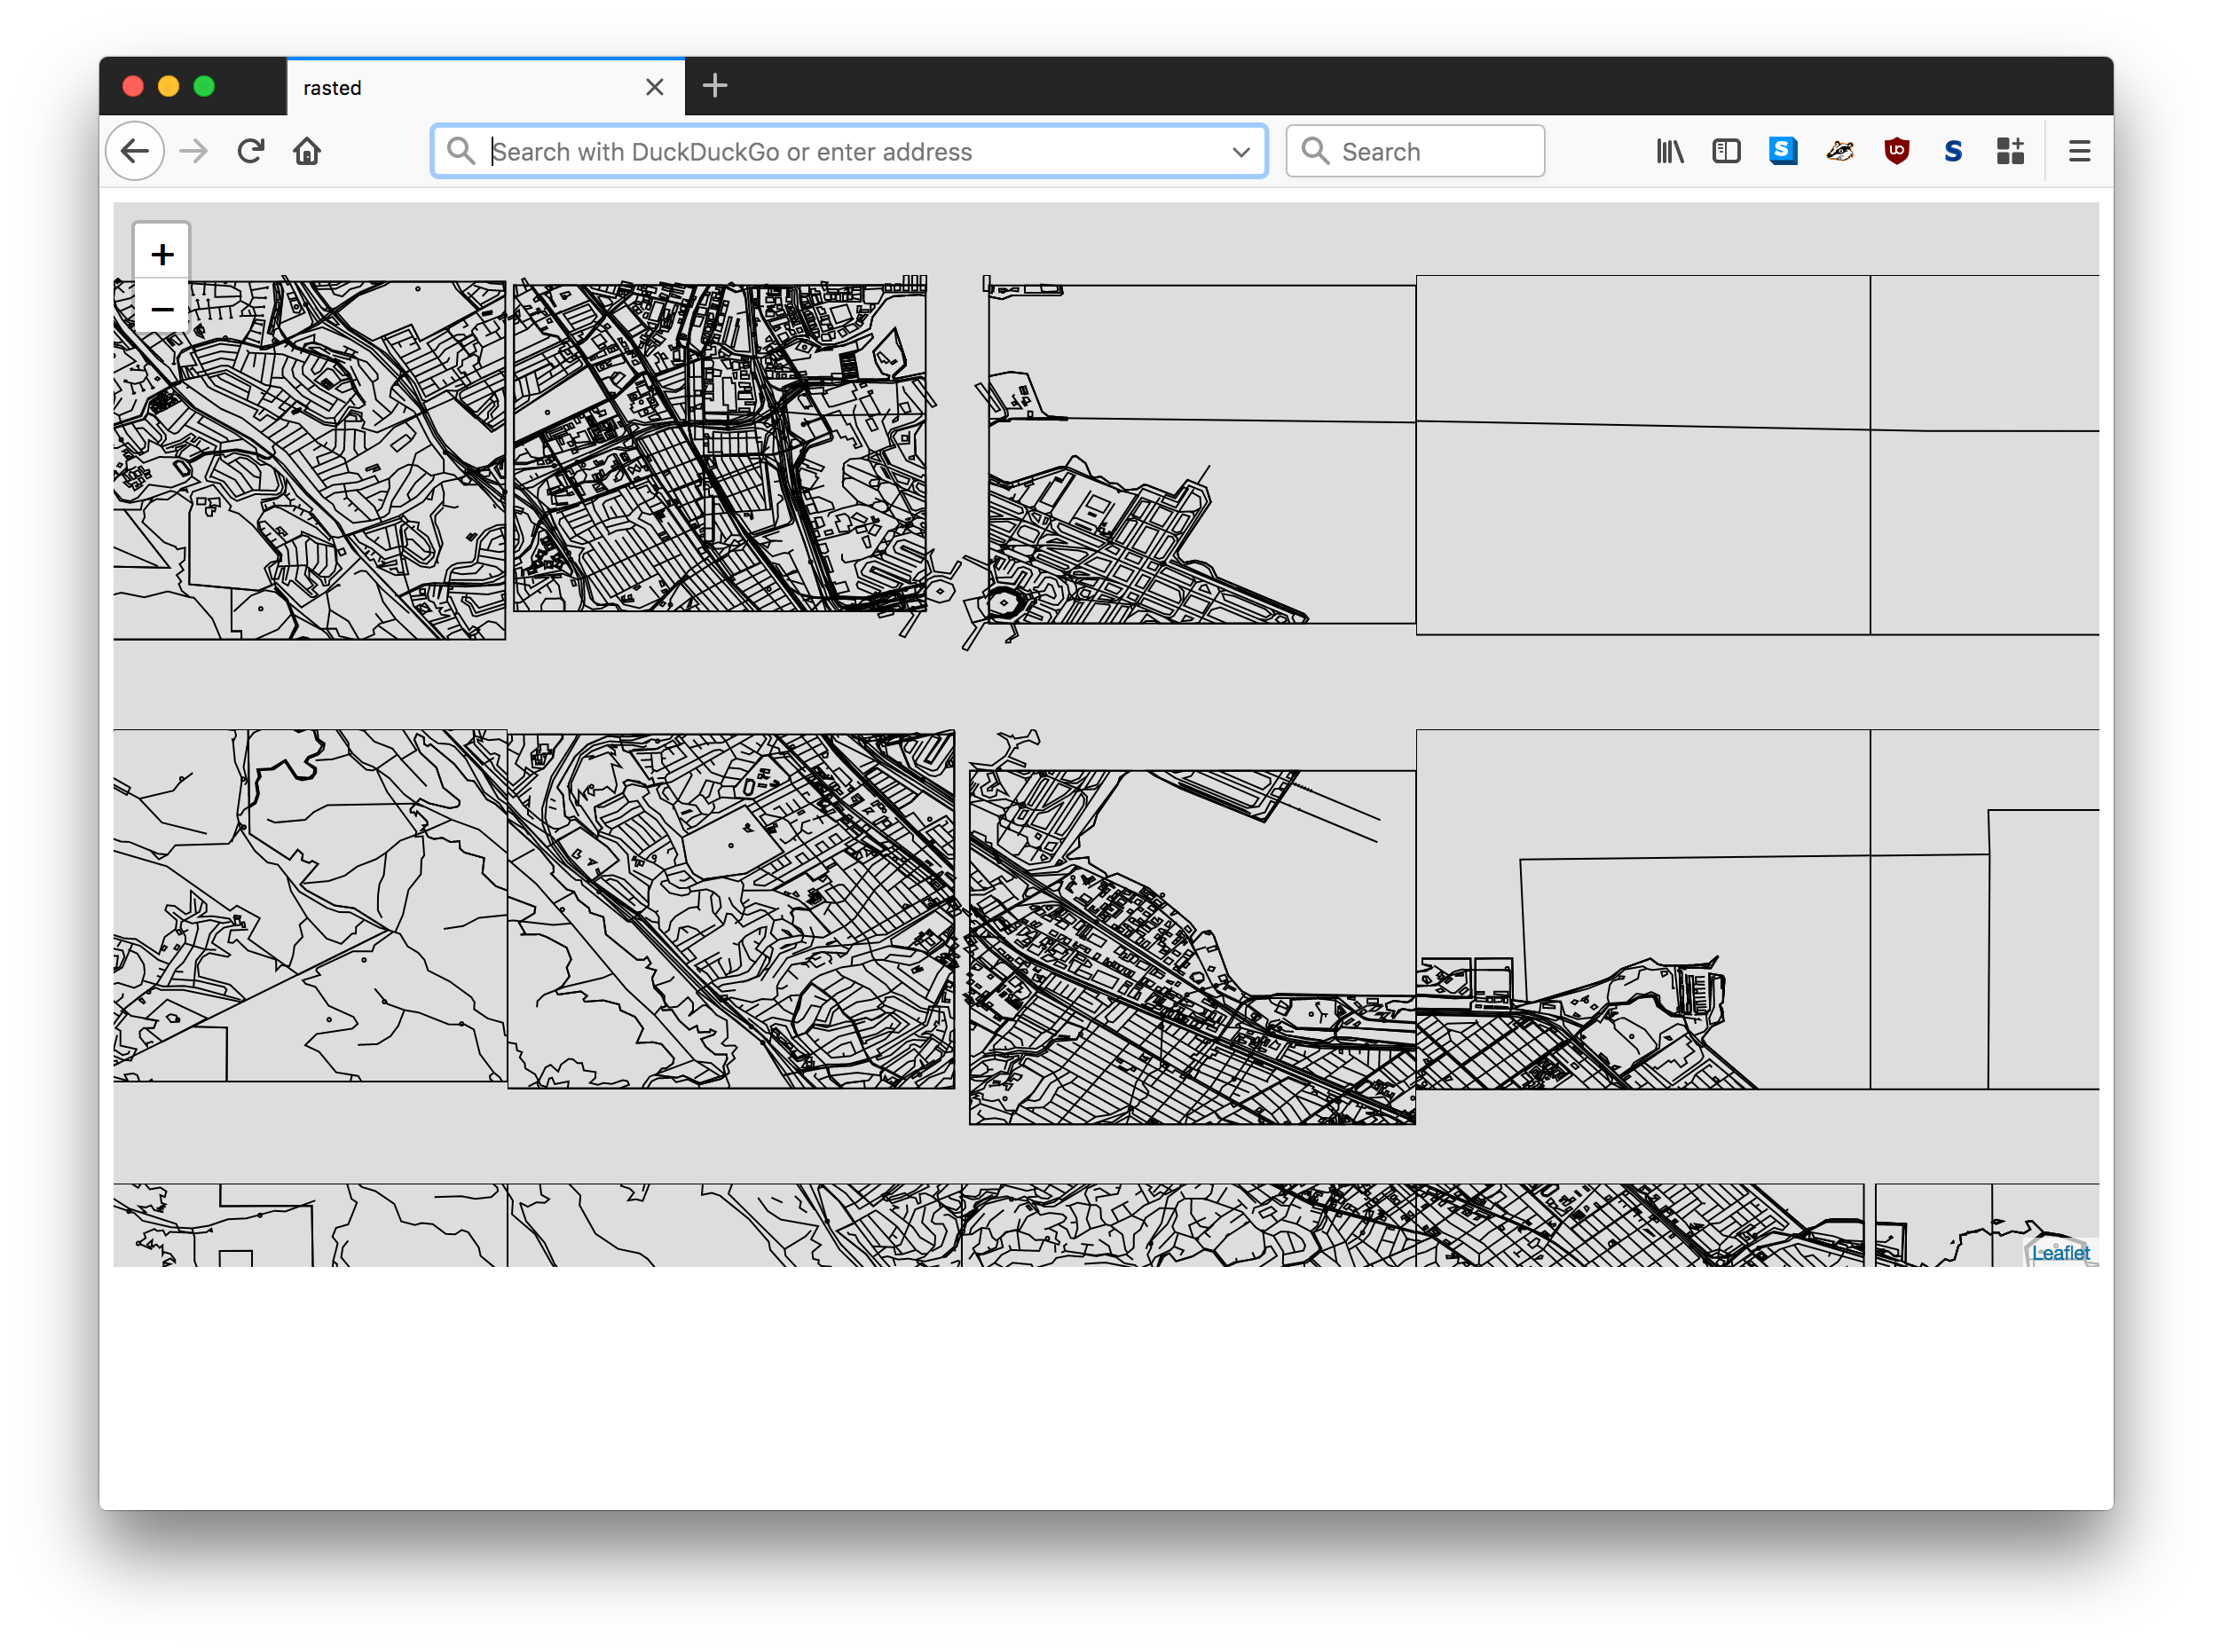
The SVG and PNG tiles that are created are highly stylized and can not be customized at the moment. Polygons, points and lines are all stroked black and polygons are assigned an arbitrary (white) fill with a 10% opacity. Otherwise the backgrounds on all the tiles are transparent.

For example, here is a single map tile whose img container has been assigned a pink background color (using CSS) which is, in turn, contained by a div element whose background color is yellow:
#tile-samples {
      width:400px;
      margin: 0 auto;
      background-color: yellow;
}

#tile-samples img {
      max-width:200px !important;
      margin: 25px;
      background-color:pink;
      border:5px solid #000;
      display:inline;
}
Did you notice the thin border around the edges of the tile? This is an
artifact of the way that ocean and coastline data in OpenStreetMap is
encoded. It’s a known-known that all tile rendering libraries account for, in their own fashion, but
rasterd hasn’t gotten there yet.
Every Nextzen tile includes a robust catalog of metadata that can be used for sorting, filtering or drawing the map data. Here is a map of SFO and the surrounding area where every feature, including the bay and the coastline, has been color-coded according to its Nextzen “kind” value.

rasterd doesn’t take advantage of this metadata. Yet.
When it comes to PNG (image) tiles the easiest way to think about them, right now, is that they are slow to produce. Depending on how you’ve configured rasterd this can lead to tiles failing to render because the server gets exhausted and gives up.

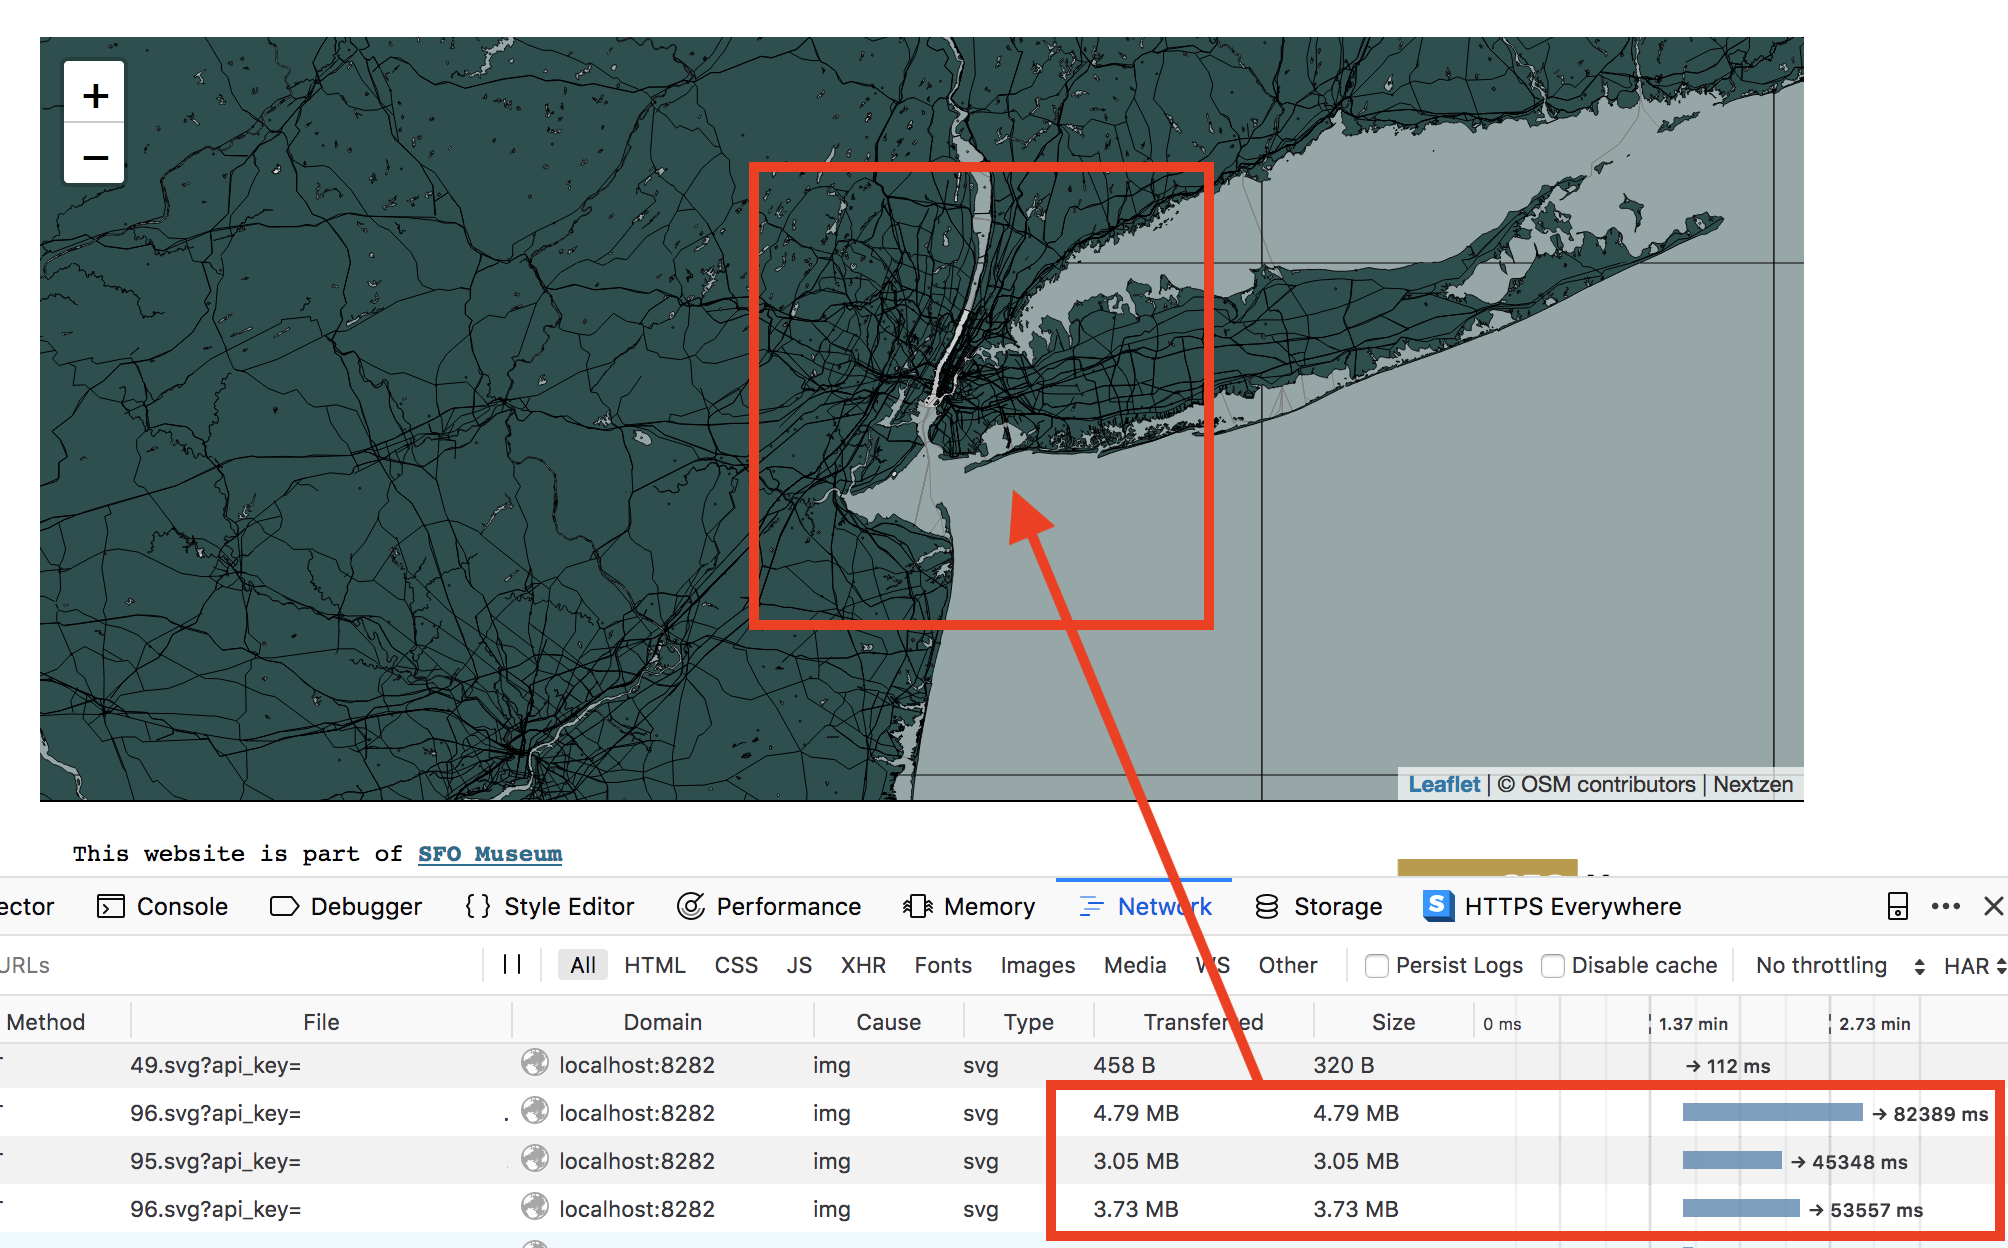
Even rendering SVG tiles can be prohibitively slow depending on the location. These tiles of New York City eventually rendered but as you can see, in this screenshot, it took just under 90 seconds for a single tile to render running locally on my laptop.
rasterd can be run as a standalone web server or as an Amazon Web Services (AWS) Lambda
function. This can be incredibly
useful if you want to pre-render all of your tiles offline, using Amazon’s giant computers to do all the work.
If you want to use rasterd as a Lambda function that is part of a user-facing endpoint then
you should be aware that this will involve a few extra steps beyond the usual button-pressing that doing anything with AWS involves.

rasterd as an AWS Lambda function.You’ll need to configure your Lambda function to run behind an AWS API Gateway endpoint with a
LAMBDA_PROXYintegration.API Gateway has a maximum execution timeout of 30 seconds (compared to Lambda’s five minutes) which may not be enough to render a larger tile, especially a PNG tile.
If you want your API Gateway endpoint to return PNG files as actual images (and not base64 encoded blobs of text) then there is even more button-pressing you’ll need to do when setting things up.
After all of that if you want to use these PNG tiles with a mapping library, like Leaflet you’ll still need to use a custom library to fetch those tiles. You can write your own code to that but there is also code included with the
go-rasterzenpackage.
Lastly, labels. Have you noticed that there are no labels in any of the screenshots? That’s because go-rasterzen doesn’t even try to tackle labels right now because labels are proper hard.
The confidence to try something else
As you can see it really is early days and there are a lot of details to account for but it works and, most importantly, it is something we can build on going forward.
The maps that rasterd produces are only one possible map and without question they are more
atmospheric than they are narrative. They are certainly not
maps to land airplanes by, for example.
They may not even end up being our “default” map and I think it’s fair to ask whether they are even a “good enough is perfect” map.
Maybe these maps are simply a fail-safe, pre-rendered and only used when nothing else works. Their value then comes from giving us the confidence to try a more sophisticated approach while still having a way to get home safely, so to speak.

Which is a good thing. If you’d like to try using our rasterzen map, keeping in mind all of the provisos mentioned in this blog post, you can do so here: